The problem it solves: the wrong size
The fastest way to burn an account — prop or personal — isn't the wrong signal: it's the wrong lot. Manually computing the correct size for every trade (risk %, stop distance, pip value on the symbol) takes time, and under pressure you get it wrong. The classic prop account burned by a badly rounded lot is not a legend.
FastAutolot eliminates the manual calculation: you decide how much to risk, it computes how much to buy.
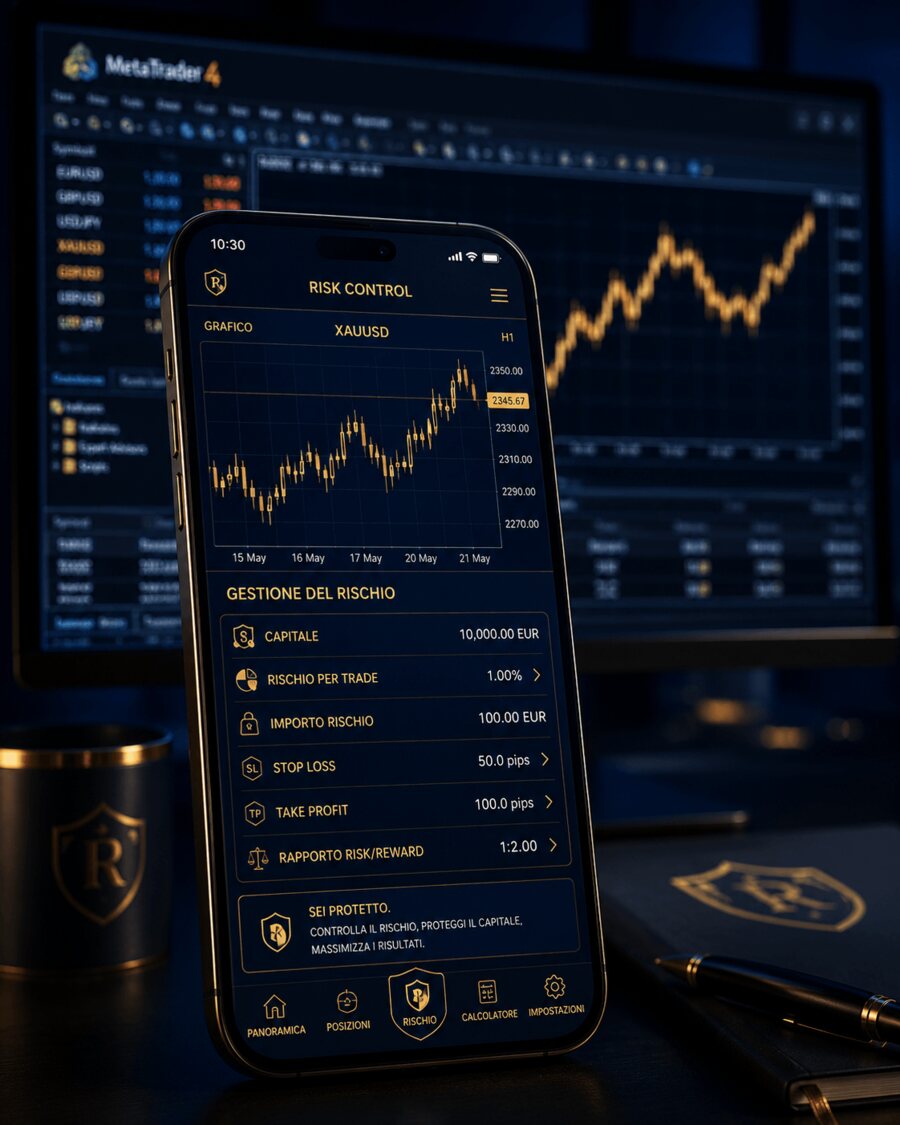
3 risk levels, even from mobile
You map three risk percentages to three symbolic sizes: open 0.01 lots from your phone and the EA on your PC opens the position with a real 0.25% risk; 0.02 = 0.50%; 0.03 = 1%. Fully customizable. The calculation happens server-side: your phone doesn't do the math, the system does.
Risk in money, not just %
You can set a fixed currency risk: with €70 configured, the EA adjusts the lot size so the stop distance is worth exactly €70. Total control, no surprises — essential under prop constraints where every violation is final.
Auto TP, break-even and partials
Auto take-profit, auto break-even and partial closes straight from the utility, with the essentials printed on the chart: the 3 risk levels, the active risk type (percent or fixed), automation status. Everything visible, nothing to remember.
Seller rating 4.5/5 on MQL5 · "Life trading changer! Lots calculator directly from the phone" — verified review